Cristalyse
Charts
Why we built this
Flutter charting libraries forced a trade-off between beauty, performance, and ergonomics. Nothing felt native or matched the power of tools like ggplot2.
We wanted to bring Grammar of Graphics to Flutter—type-safe, performant by default, and beautiful out of the box.
We built an open-source library with GPU-accelerated rendering for 60fps animations, a composable API to mix geometries, and built-in interactivity with beautiful default themes.
"Developers shouldn't fight their tools to build great charts. Cristalyse is open source under MIT and makes stunning data visualization effortless in Flutter."
Best Features

Native Performance
GPU-accelerated rendering with 60fps guaranteed performance.
Grammar of Graphics
Intuitive API inspired by ggplot2 and Vega for powerful visualizations.
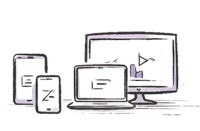
Cross-Platform
Run everywhere Flutter does — iOS, Android, web, and desktop.
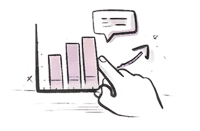
Interactive Charts
Touch gestures, tooltips, and smooth animations built-in.
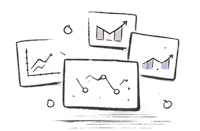
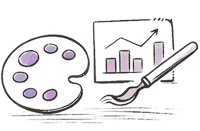
Rich Chart Types
Bars, lines, areas, scatter plots, and custom geometries.
Theme System
Beautiful built-in themes with full customization support.
What people say
"Thank you for this amazing library!"

Isabel
Data Scientist"Thank you for creating such a wonderful charting library."

Anonymous
"Thanks for creating this amazing library. Really enjoying exploring it. I like how creating different charts is quite easy with it."

Arbaz Irshad
Developer"It took all of 10 minutes to replace an old integration of community_charts_flutter with a working Cristalyse implementation, and way, way less code."

Colin Young
Developer"This package already looks promising, as right now, there are almost no good solutions when it comes to charts in Flutter. Great job!"

Kostiantyn Selivanov
Developer"LLMs are pretty good at building a Cristalyse chart with a clear spec and a light translation layer they can point to."

David Richmond
Related Notes
Want us to build for you?
The same team behind LeedPDF, Golden Day, PinkRain and more is available as your product design & development partner.